Back
25 Feb 2020
AUD/USD Price Analysis: Major correction on the cards according to momentum divergence
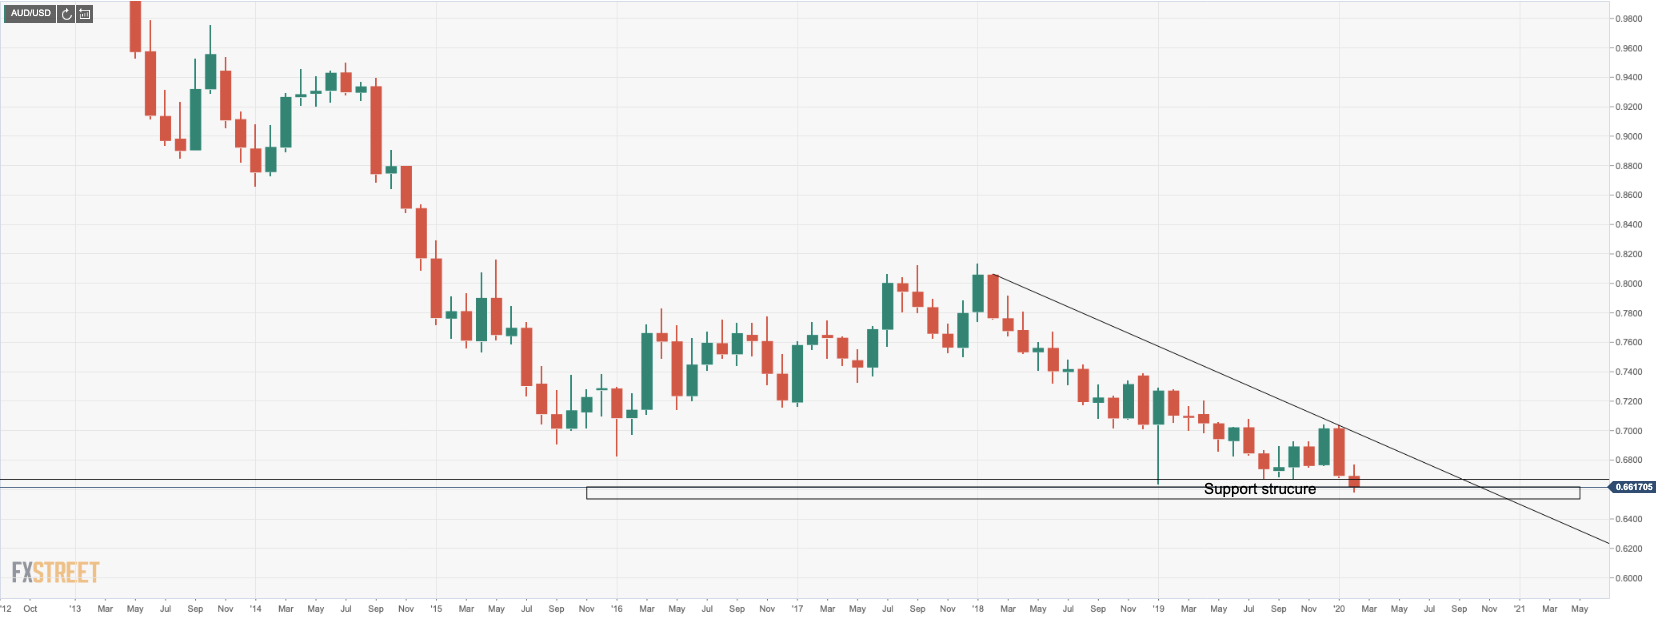
- AUD/USD last week eroded the 2018-2020 support line at 0.6657.
- AUD/USD has made the lowest low in a decade and following an 8-year run to the downside, it could be time for a healthy correction.
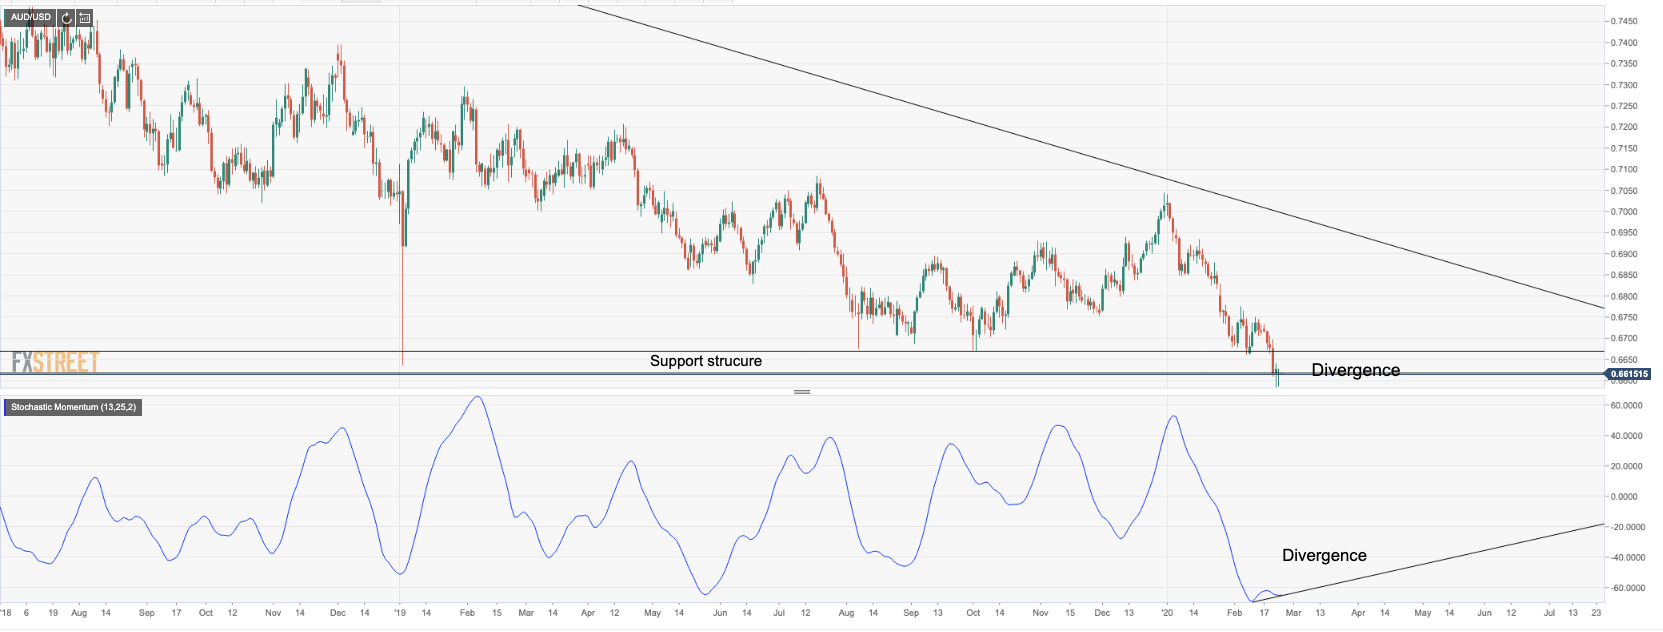
- AUD/USD's momentum divergence with the price is compelling.
- The last divergence seen as this was at the start of the Jan 2018 downtrend, some 18.7% higher (or 1526 pips ago).
- Bulls will target structure towards the 23.6% Fibonacci of the Dec 2019 downtrend ahead of 38.2% Fibo in the 0.67 handle.
- On the downside, the monthly chart offers vulnerable to further weakness to the 0.6535/.6488 on the weekly and monthly charts.
Bulls at monthly support structure, but below 2018 support
We are seeing a divergence in momentum
5 Wave bullish outlook towards 61.8% golden ratio target
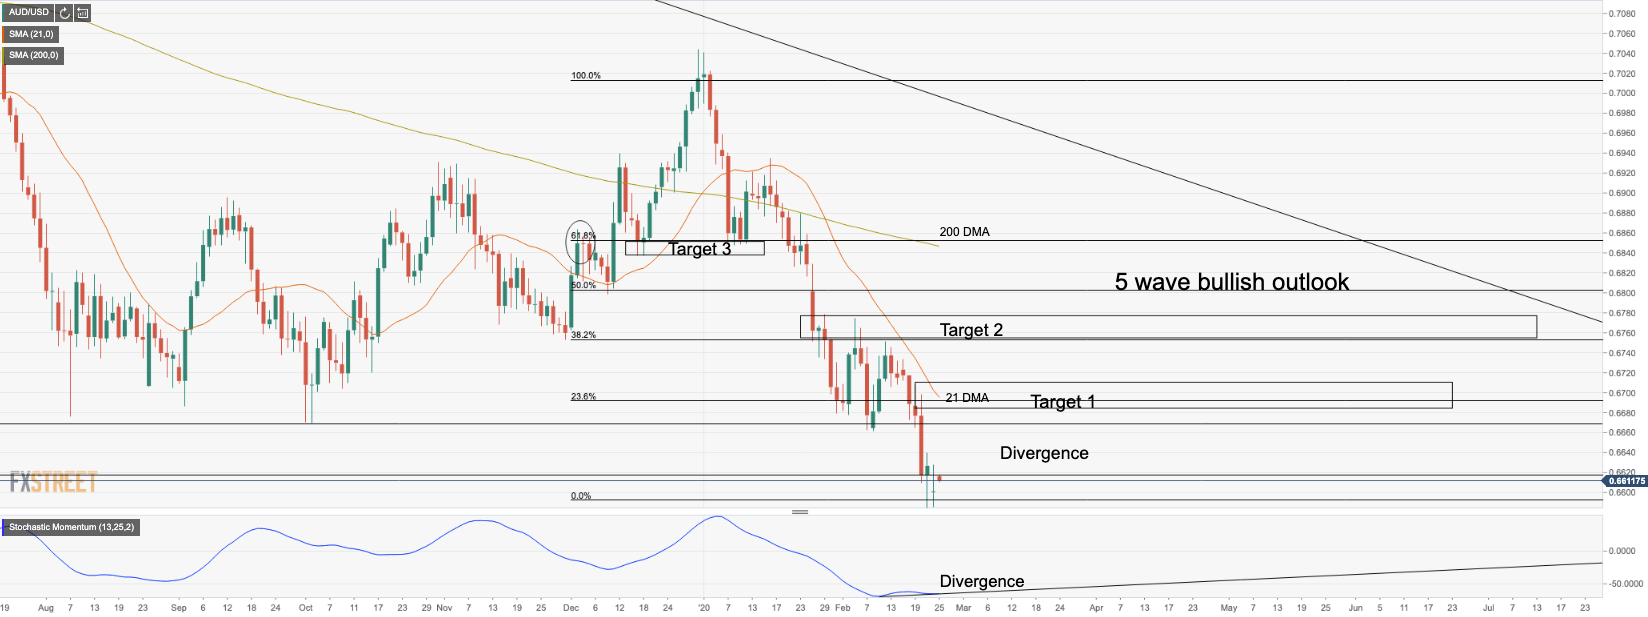
The bullish projection aks the price back to an H&S resistance neckline as marked by the Target 3 on the chart, with the confluence of a 61.8% Fibonacci retracement (the golden ratio). The price will likely move in stages through the various confluence targets and volume nodes of the 23.6% and 38.2% Fibos on five waves overcoming the accelerated downtrend at 0.6701. The 200-day ma is also located at 0.6850 guarding the 0.6933 January high.
Key fundamental notes to consider
- Despite the coronavirus hic-up, the relation trade could be back on the cards.
- Casting minds back to the reflation trade of 2009, AUD soared as when the world reflates, export-oriented economies will benefit the most.
- RBA meeting in March will be crucial as will the next unemployment rate.
- Any sign in next week’s meeting that policy-makers’ concerns regarding coronavirus are escalating will increase the risk of another 25 bps reduction in rates in the coming months.