GBP/USD Price Analysis: At a make or a break around 1.1200
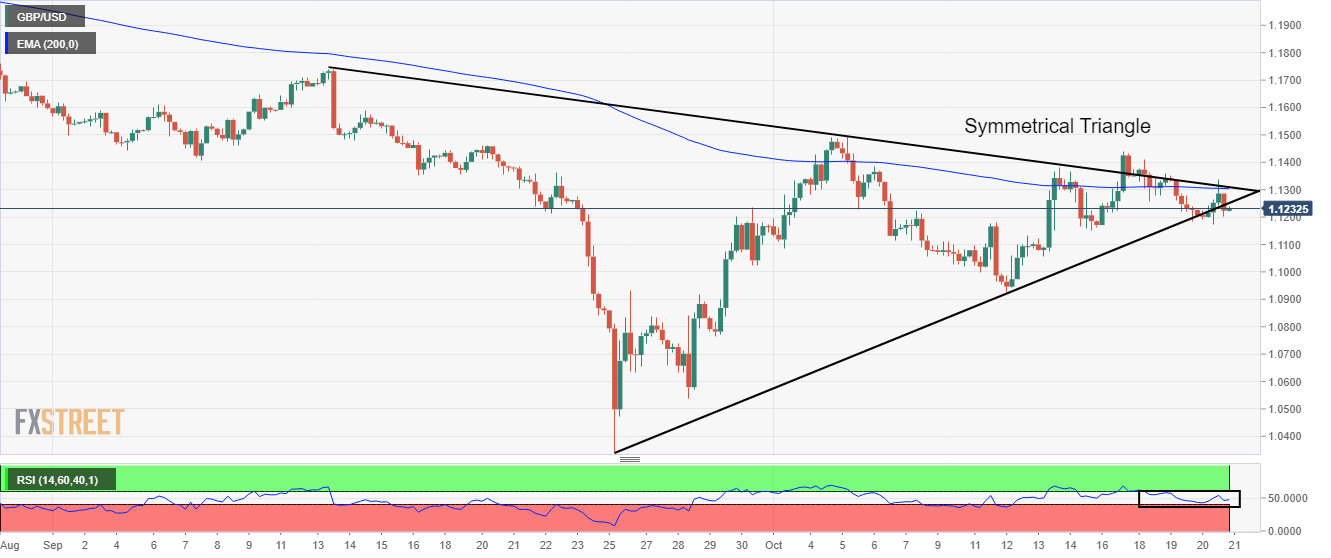
- The cable is on the verge of an explosion of the symmetrical triangle.
- Resignation from novel UK Prime Minister Liz Truss underpinned the risk-aversion theme.
- The 20-EMA is acting as a major barricade for the pound bulls.
The GBP/USD pair is struggling to surpass the immediate hurdle of 1.1240 in the early Tokyo session. The pound bulls witnessed a steep fall from 1.1336 on Thursday as the risk appetite of investors was trimmed led by soaring yields and UK political crisis after novel UK Leader Liz Truss resigned.
The returns on 10-year US government bonds skyrocketed amid a dismal market mood as the market participants are considering the 75 basis points (bps) rate hike by the Federal Reserve (Fed), a certainty now. Apart from that, soaring yields also supported the greenback in vaporizing early gains and ending the New York session with negligible losses of around 113.00.
On a four-hour scale, the cable is on the verge of exploding the symmetrical triangle chart pattern. The downward-sloping trendline of the above-mentioned chart pattern is placed from September 13 high at 1.1738 while the upward-sloping trendline is plotted from September 26 low at 1.0339. An explosion of volatility contraction pattern results in wider ticks and heavy volume.
The 200-period Exponential Moving Average (EMA) at 1.1300 is acting as a major barricade for the counter.
Meanwhile, the Relative Strength Index (RSI) has shifted into the 40.00-60.00 range, which signals a consolidation ahead.
Going forward, an upside break of Monday’s high at 1.1440 will drive the cable towards September 14 high at 1.1590, followed by September 13 high at 1.1738.
On the flip side, a drop below the 50-EMA at 1.1200 will drag the asset toward the psychological support of 1.1000. If cable surrenders the psychological support, it will expose to more downside towards October 12 low at 1.0924.
GBP/USD four-hour chart